
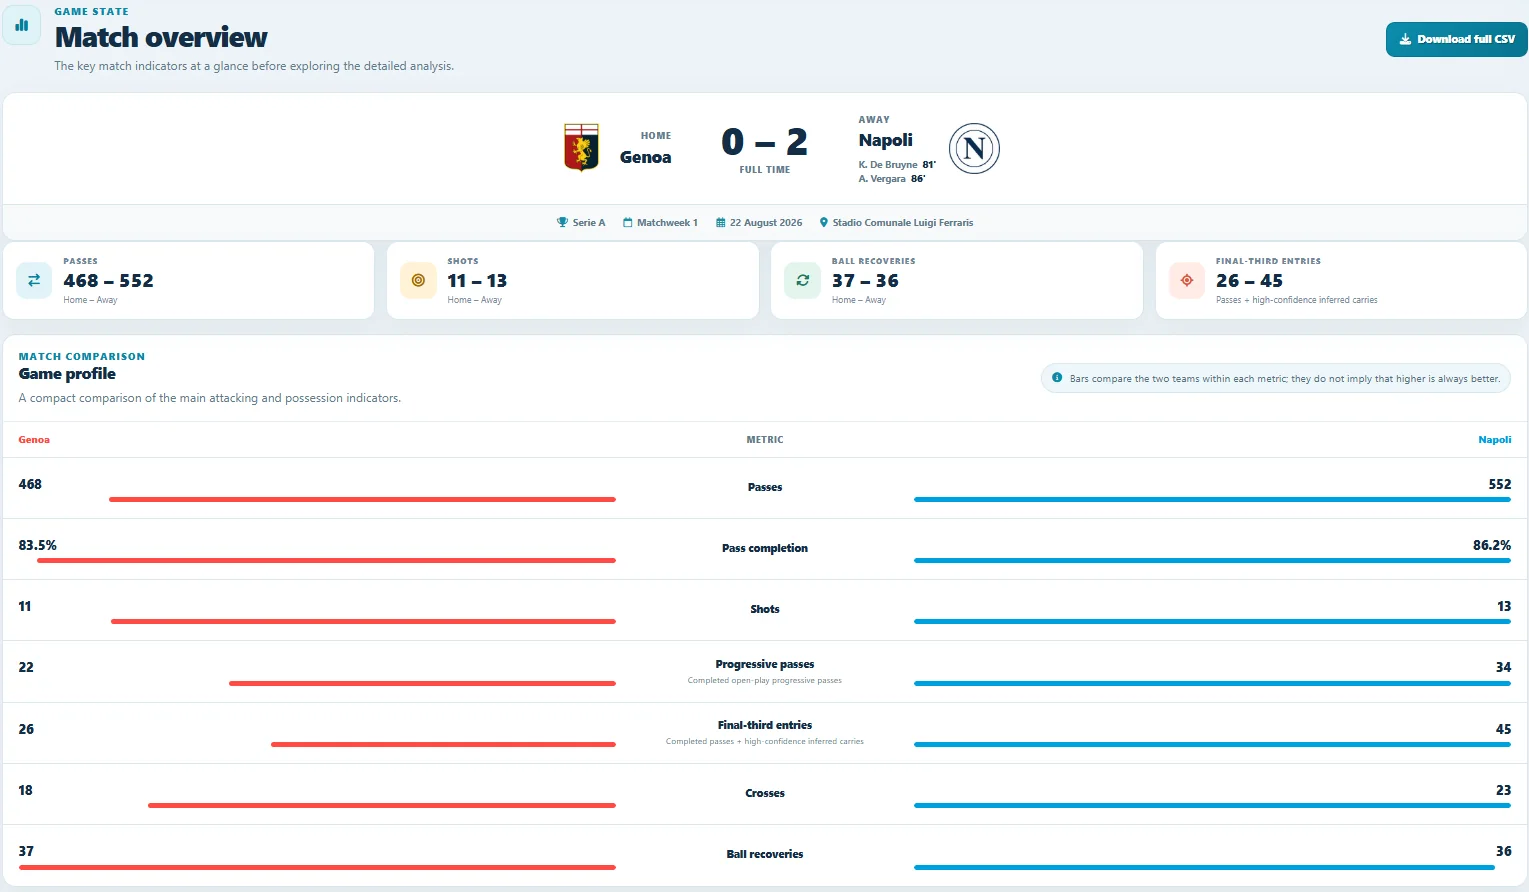
For most of the game, Genoa-Napoli is much more open than the final 2-0 might suggest. Genoa are not overwhelmed: they take 11 shots to Napoli's 13, recover almost the same number of balls and keep finding transition moments.
The game changes mainly after half-time. Napoli start playing more and more in Genoa's half, move forward with greater continuity and find more ways into the final 30 metres.
The goals from Kevin De Bruyne and Antonio Vergara arrive only in the final ten minutes. The game had started to change earlier.
After half-time, the game moves upfield
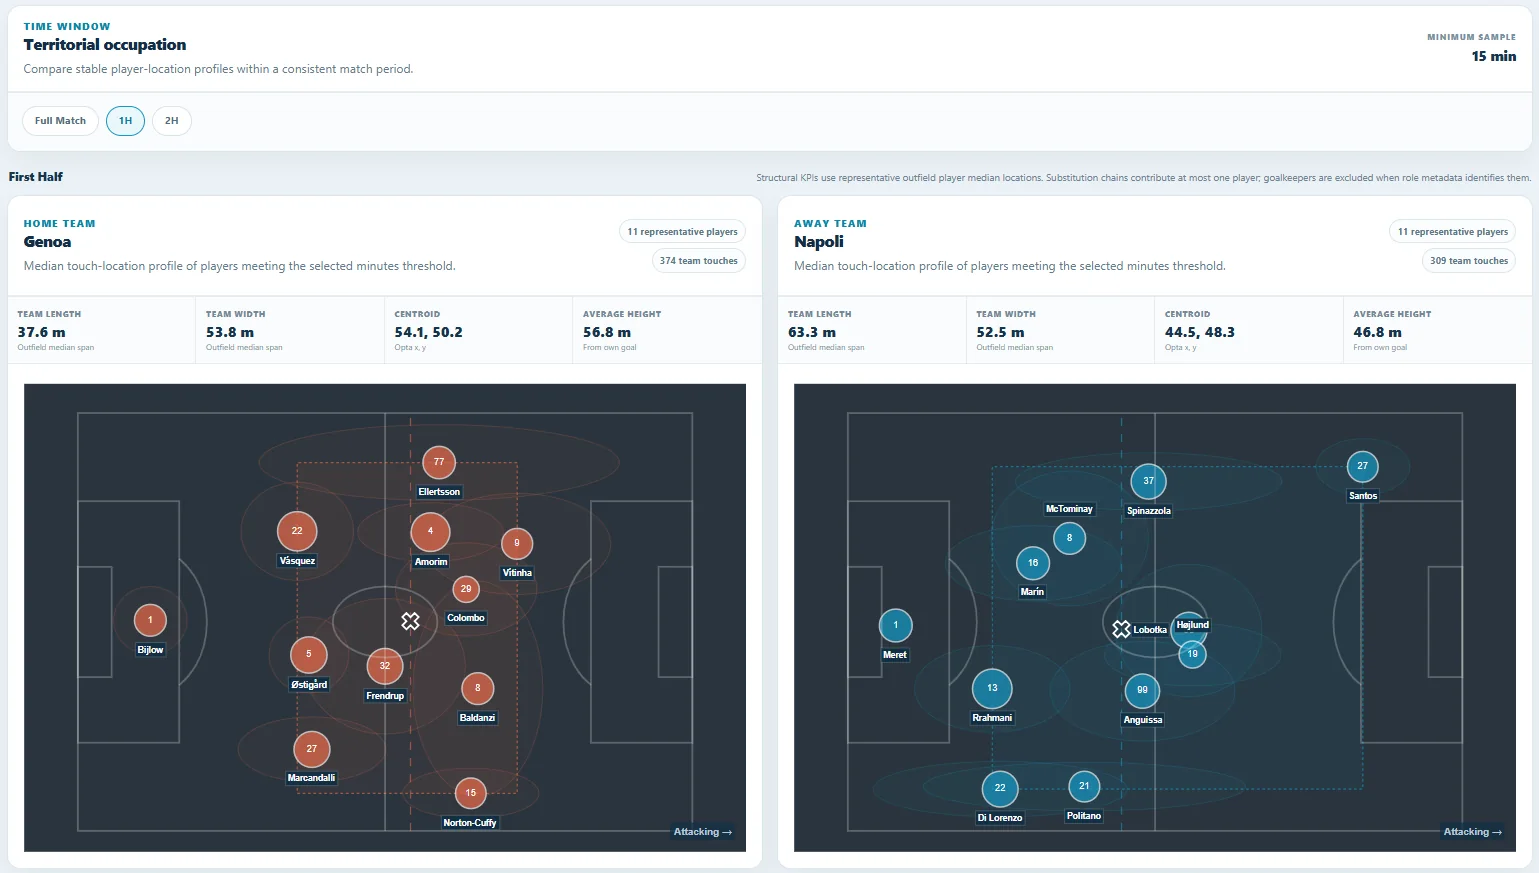
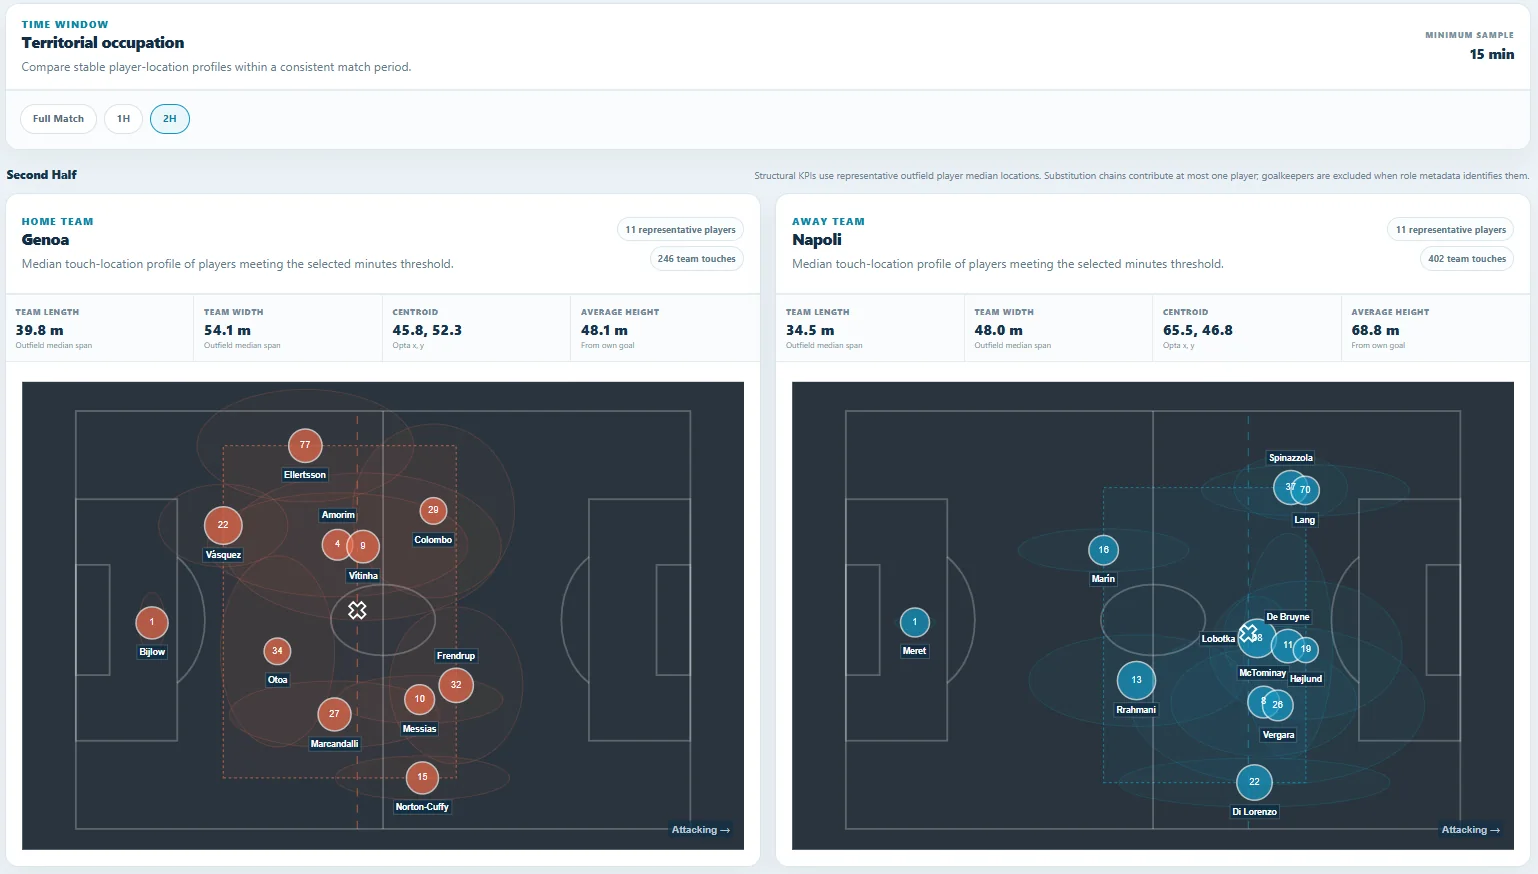
In the first half Genoa manage to play, on average, higher up the pitch. The home side spend more time in advanced areas, while Napoli operate further from Genoa's goal.
After the break the picture changes. Napoli move their average area of play roughly 21 metres higher than in the first half, while Genoa drop back.
That does not mean Napoli dominate every minute of the second half. It does mean the game is increasingly played where Napoli want it: in Genoa's half
The maps show where player touches and events are concentrated. They are not continuous tracking positions.
See the chart numbers
1H: average pitch position 54.1 Genoa / 44.5 Napoli; average height 56.8 m / 46.8 m.
2H: 45.8 Genoa / 65.5 Napoli; average height 48.1 m / 68.8 m. Napoli's longitudinal profile also drops from 63.3 m to 34.5 m.
The defensive-shape proxy follows the same movement: Genoa 36.6→31.5 m; Napoli 26.5→43.3 m.
Genoa still look for territory quickly
Genoa do not try to build every attack through long sequences from the back. When the chance is there, they look for territory and team-mates ahead quickly.
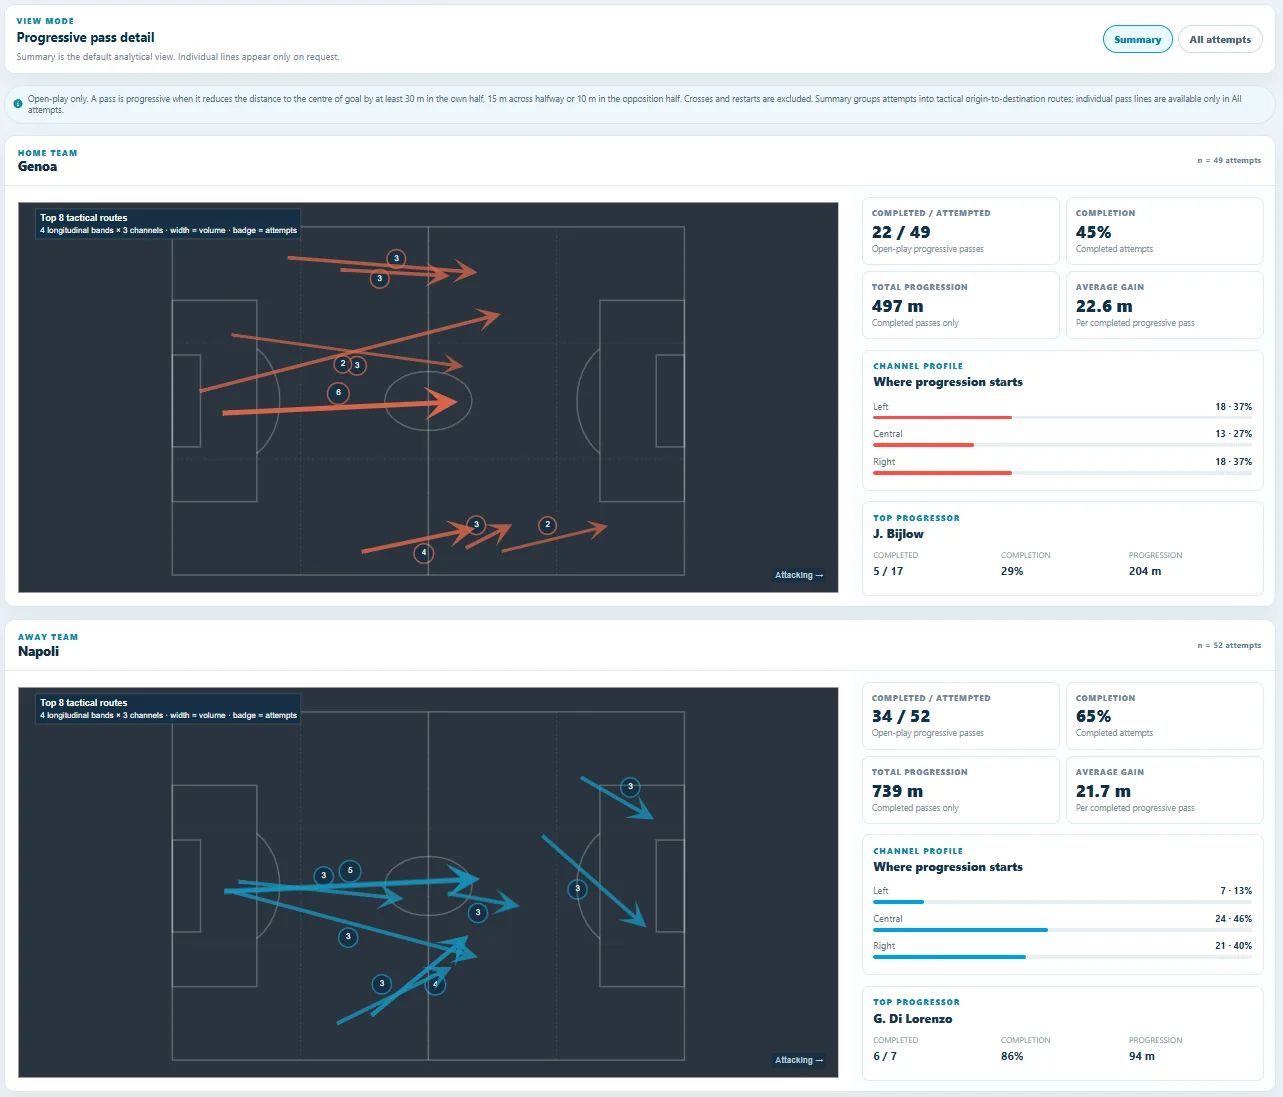
Their early build-up sequences last just over five seconds on average and contain fewer than two completed passes. Their main progressor is again Bijlow: the goalkeeper often tries to shorten the route towards the opposition half.
Napoli choose a different route. Their early sequences are longer and involve more passes, especially once they beat the first line of pressure.
See the progression numbers
Genoa: 22/49 completed · 45% · 497 m. Napoli: 34/52 · 65% · 739 m.
Bijlow: 5/17 · 29% · 204 m. Di Lorenzo: 6/7 · 86% · 94 m.
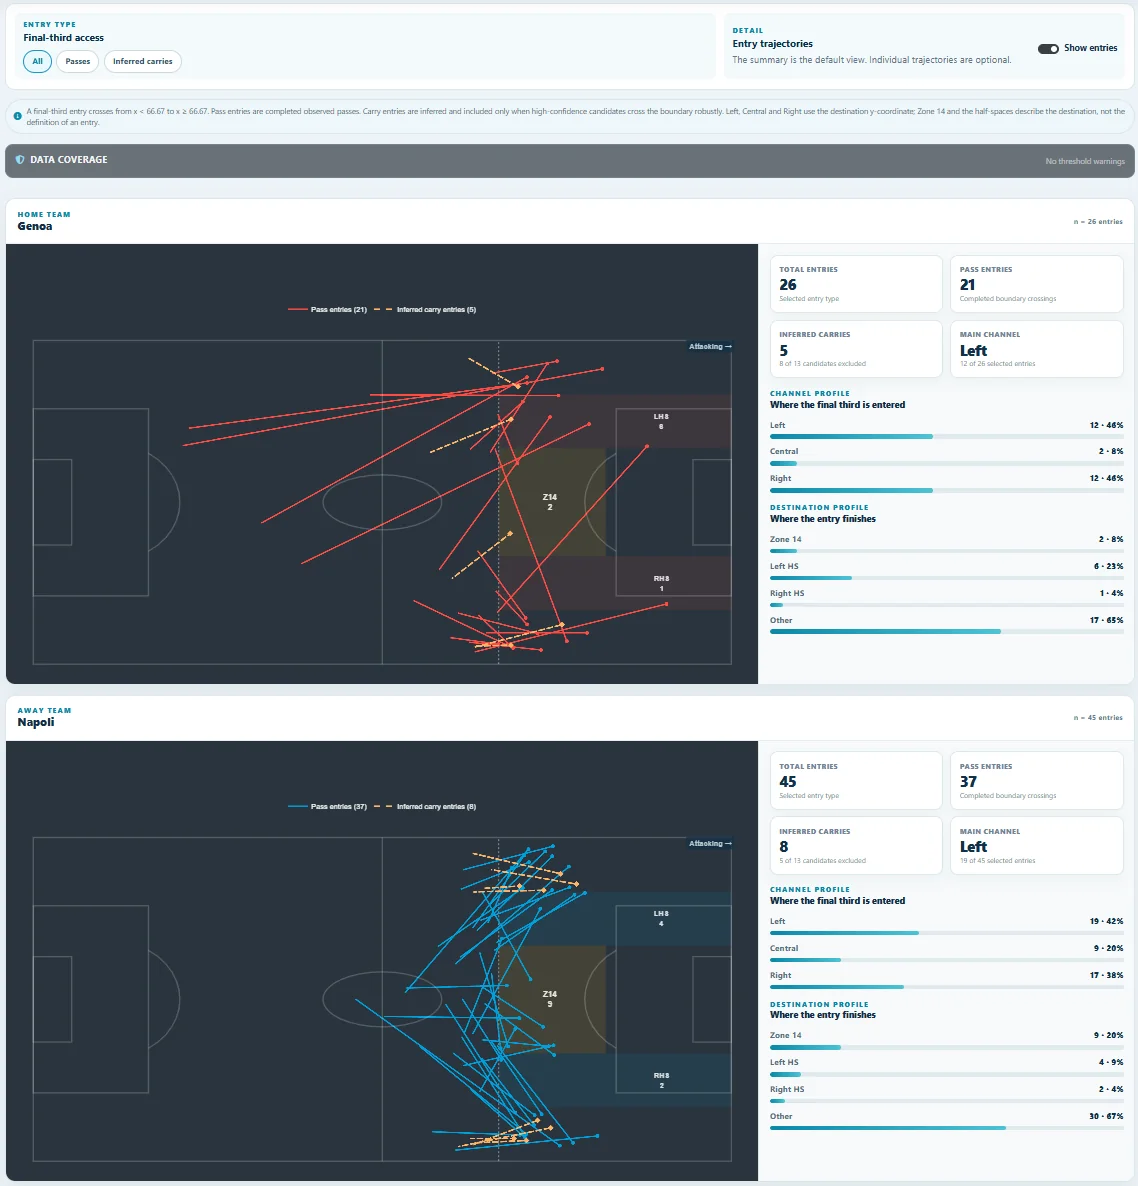
Genoa still reach the final third from wide areas
This is where the continuity with the previous Genoa-Napoli is particularly clear.
In the previous meeting, 28 of Genoa's 30 final-third entries came from wide areas. This time it is 24 out of 26
Genoa can still move the ball forward, but almost always through the outside channels. The centre remains much harder to play through.
Napoli have a wider range of routes: they enter the final third 45 times and find inside areas more often as well as the flanks. That matters: reaching the final 30 metres is not the same as reaching them in the same way.
The central area in front of the box follows the same pattern. Napoli find it much more often: another sign of a side able to create inside access, while Genoa are pushed towards the outside.
Genoa intercept and break
Napoli cannot take away one of Genoa's most recognisable weapons: winning the ball and attacking the space immediately
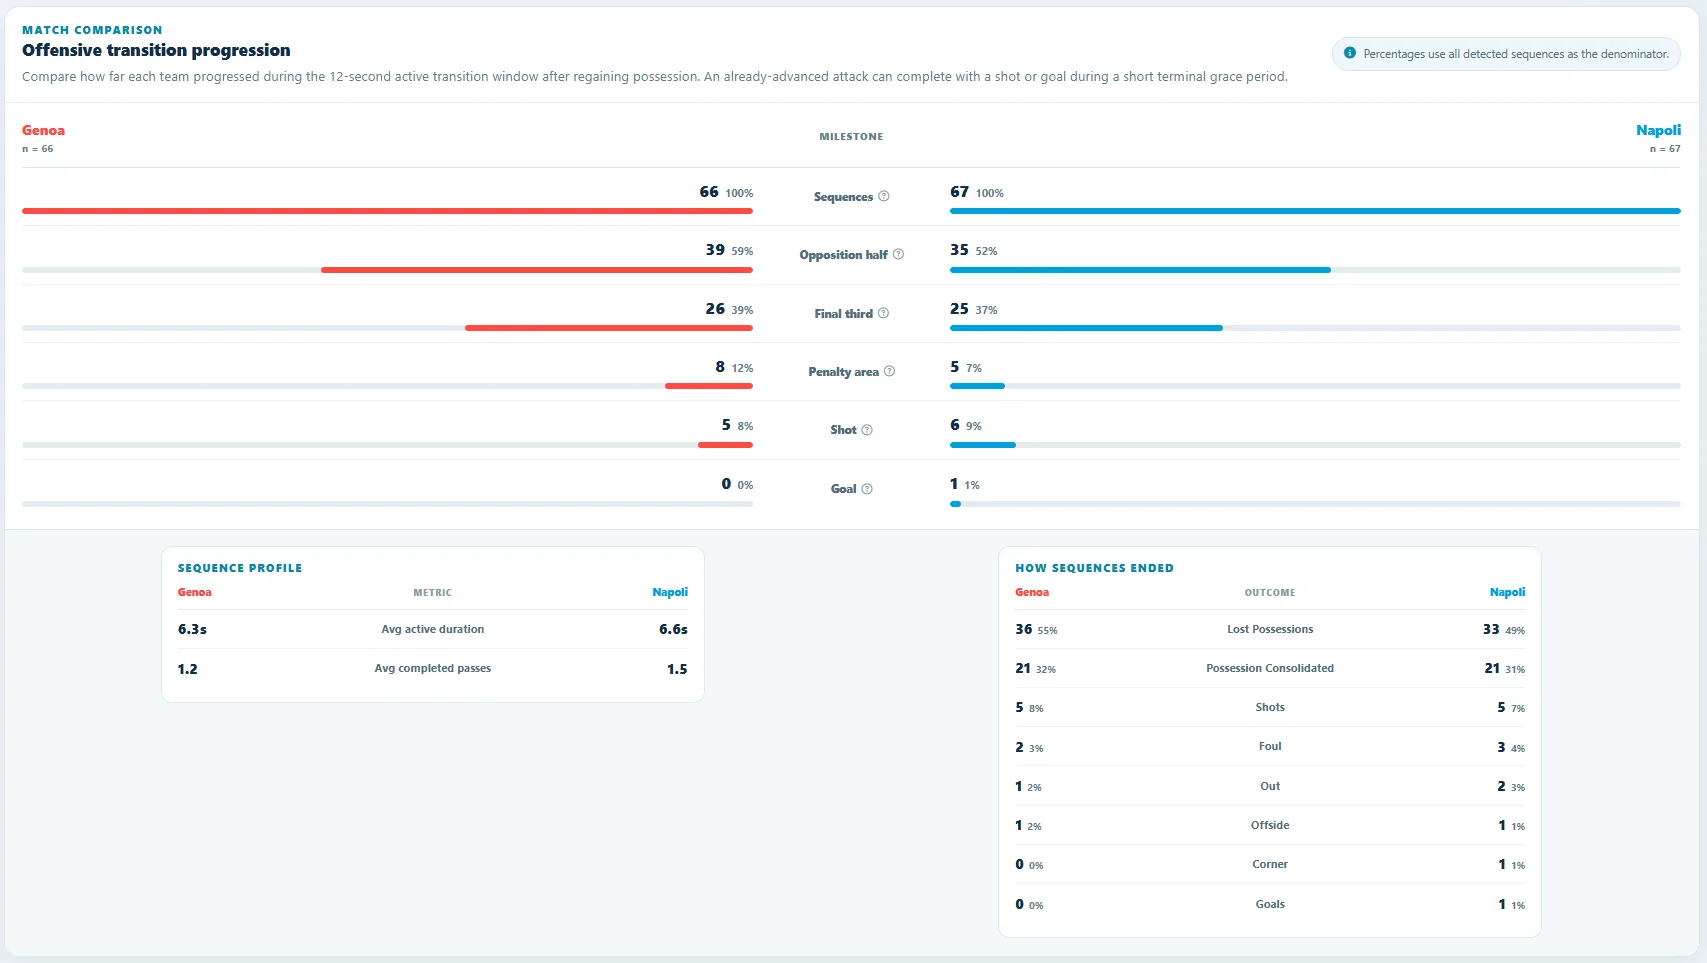
Genoa carry 26 transitions into the final third and eight into the box. The threat is still there, even if it does not produce a goal this time.
How those attacks begin says a lot about Genoa. Almost two out of every three transitions start with a pass interception: Genoa read Napoli's pass, break the line and immediately try to turn forward.
When they go, they look mainly to the left: 52% of their transitions develop on that side, almost exactly the share seen in the previous meeting.
In these moments Genoa do not necessarily want to keep the ball. They want to steal it and use the few seconds when the opponent is still open
In the previous Genoa-Napoli this behaviour produced two huge Napoli build-up errors. This time the problem is still there, but Napoli get through it without giving away the same gifts.
See the transition detail
Genoa: 66 sequences · 59% opposition half · 39% final third · 12% box · 8% shot · 0 goals.
Napoli: 67 sequences · 52% opposition half · 37% final third · 7% box · 9% shot · 1 goal.
Genoa origin: 64% pass interceptions. Direction: 52% left, 35% central, 14% right.
Napoli find more ways up the pitch
Genoa often try to shorten the route to attack. Napoli, as the game develops, build more alternatives for moving forward.
The two sides attempt almost the same number of progressive passes — 49 for Genoa, 52 for Napoli — but the return is very different: Napoli complete 34 to 22
The difference is not only about accuracy. Looking at individual players reveals two complementary ways Napoli move up the pitch
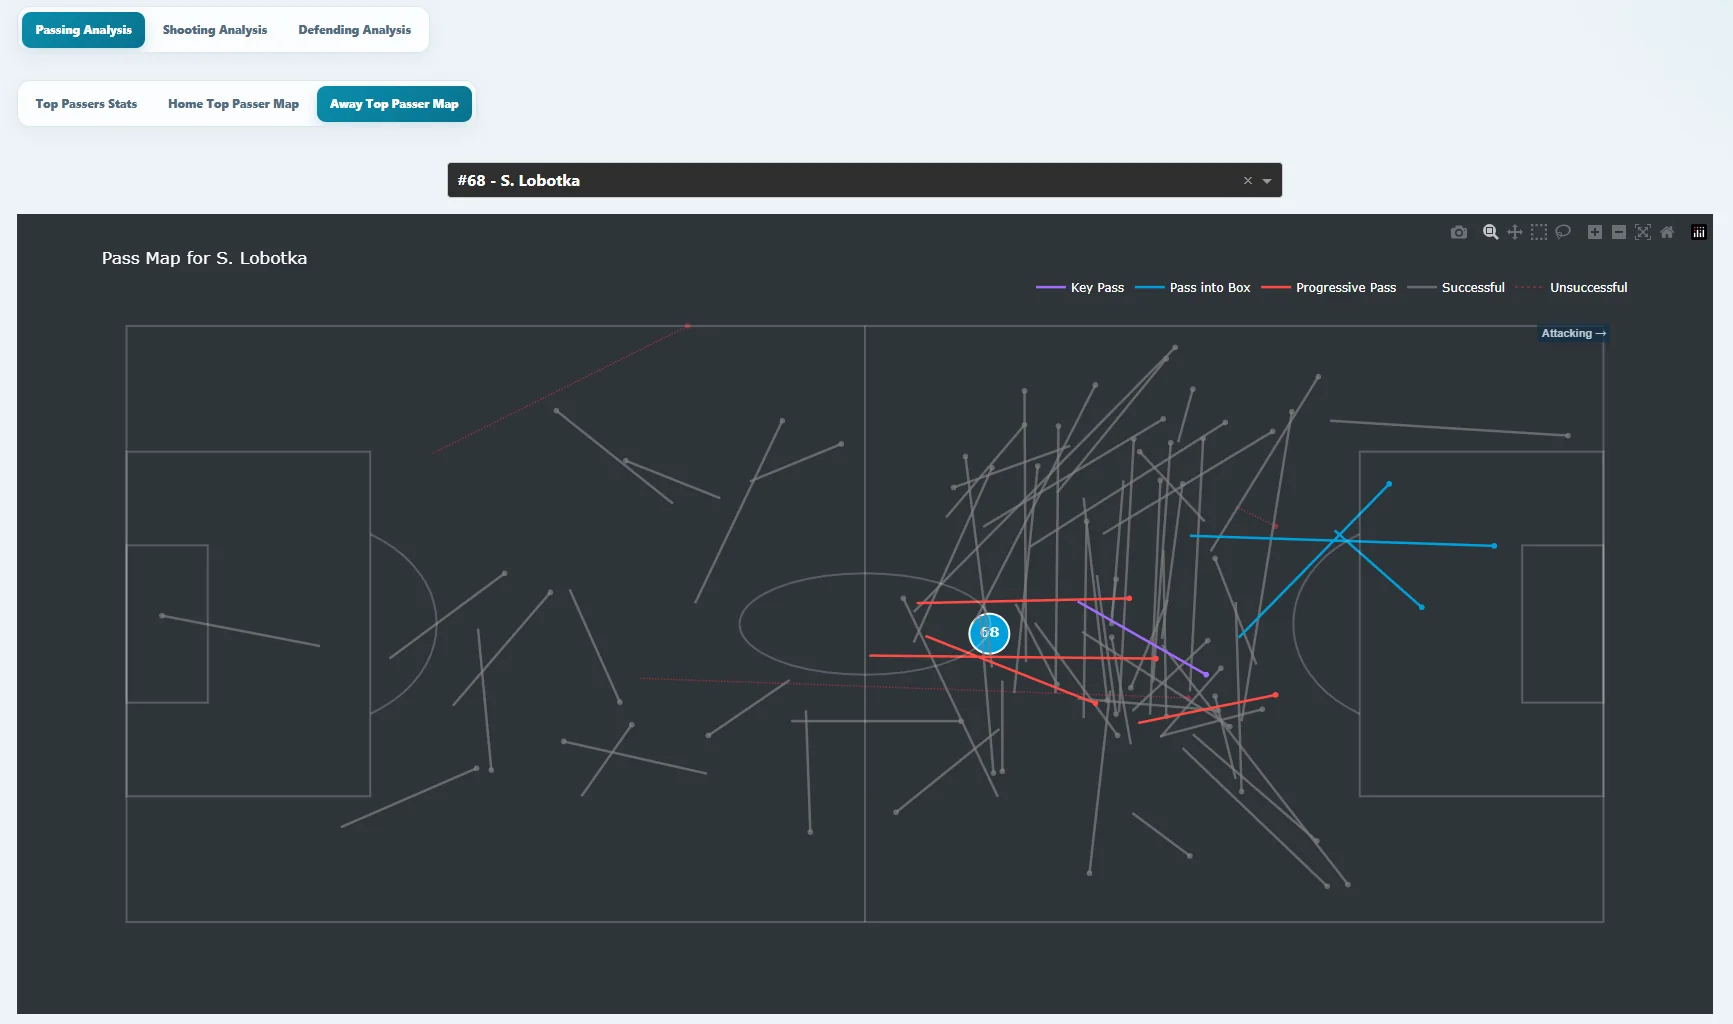
The inside reference
Lobotka helps Napoli play through the middle: he receives in central areas, connects build-up and development, and lets the move continue without forcing an immediate pass outside.
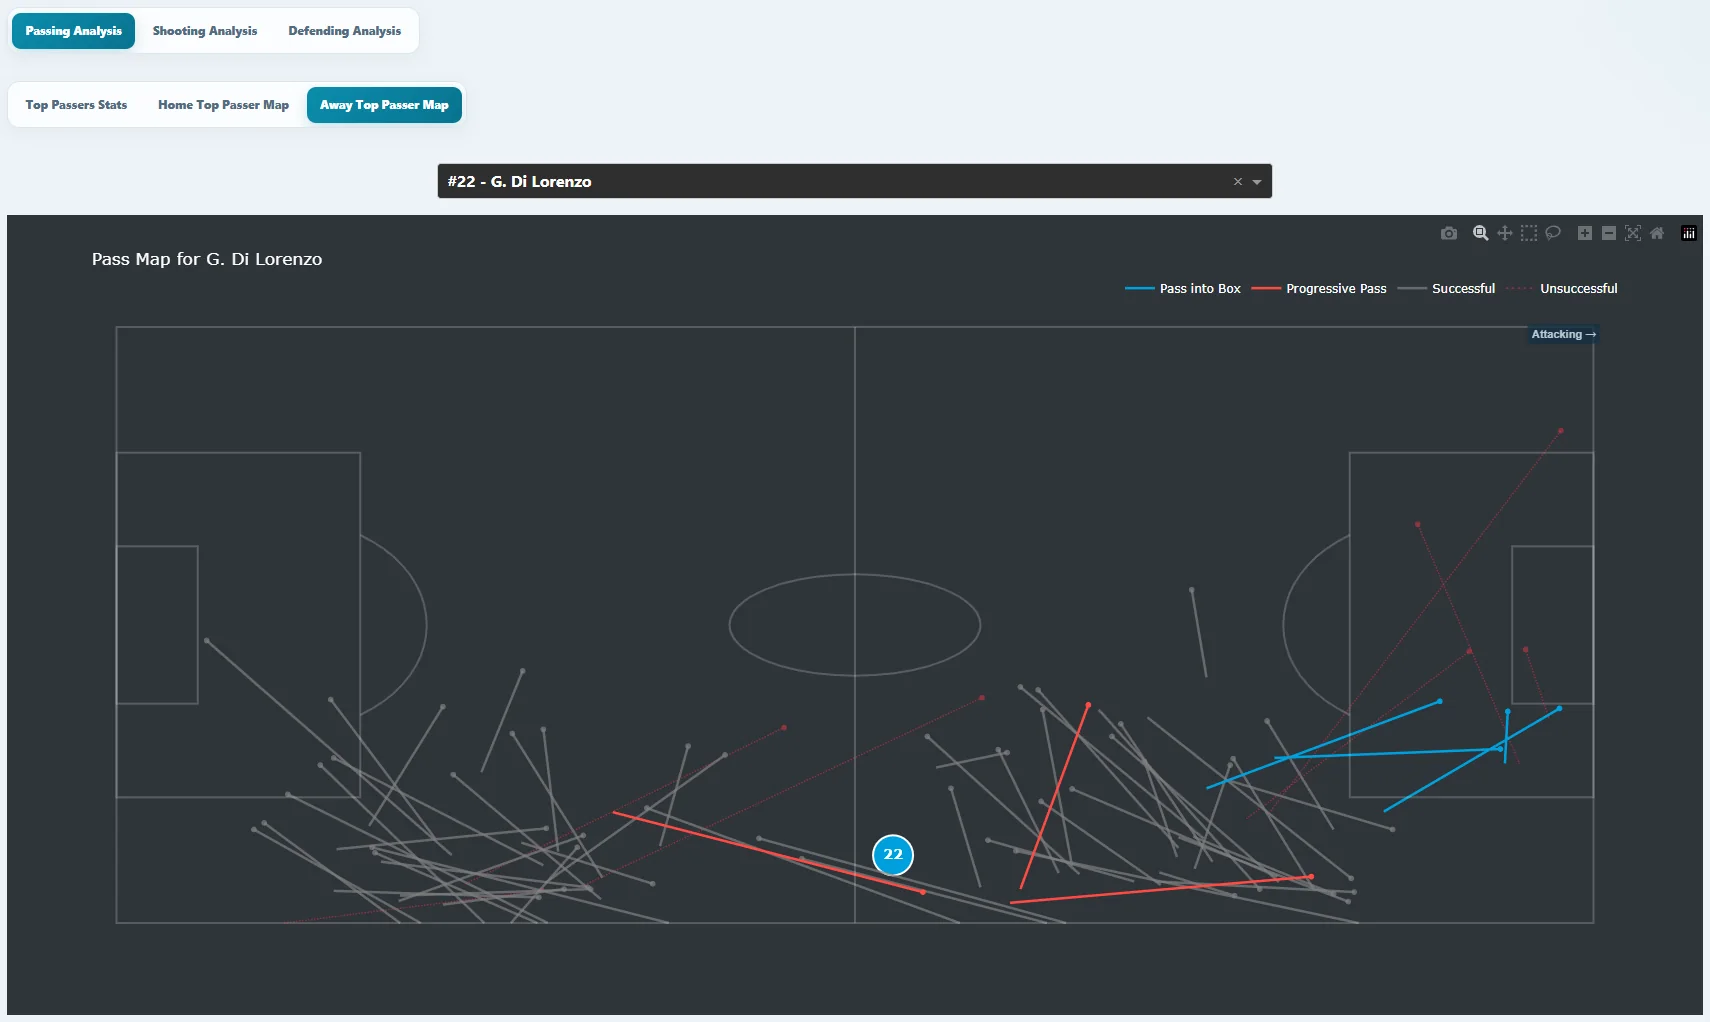
The push from the right
Di Lorenzo offers a wider route: he carries the move down the right, moves the ball higher and gives Napoli an outlet that complements Lobotka's inside control.
That variety also helps frame the comparison with what we saw before the game. Some Genoa traits barely changed; others had very different consequences this time.
From pre-match to the pitch
What stayed, what changed
The comparison is most useful when it separates behaviours that repeated from those that carried a different weight this time.
| Before the match | This time | Reading |
|---|---|---|
| Genoa direct from the first build-up | Bijlow remains the main progressor and the early sequences stay short | Clearly still there |
| Final-third access mainly from wide areas | 24 of 26 entries come from the flanks | The most stable pattern |
| Left-sided transitions and interceptions | 52% go left; almost two in three start with an interception | Genoa still look like Genoa |
| Pressure capable of hurting Napoli | Transitions still reach advanced areas, but without the decisive mistakes from the previous meeting | Napoli manage it better |
| Crosses as a possible source of danger | 18 crosses, but no shot generated inside the metric window | Wide access, much less danger |
| Space after the first pressure | 34 progressive passes completed and 45 final-third entries | More routes forward |
The crosses help separate frequency from danger. Genoa still reach the flanks very often and deliver 18 crosses, but none directly produces a shot inside the app's measurement window. Event data alone cannot prove Napoli deliberately chose to concede the outside; the picture is nevertheless consistent with a game in which Genoa find the centre harder to access and their wide attacks create little immediate danger.
Napoli decide it late
For 80 minutes Genoa remain in the game. Then two players who were not in the starting XI make the difference: De Bruyne scores on 81 minutes, Vergara on 86
The bench supplies both scorers, but that alone is not enough to turn substitutions into a tactical explanation for the win.
What happened earlier is more revealing: in the second half Napoli had already moved their game higher, increased their final-third entries and found greater continuity in progression.
One of the two goals is also classified by the app as an attacking transition starting from an interception: regain, acceleration and attack before Genoa can reset.
The score changes in the final ten minutes. The game had started changing earlier.