Michele Orefice

Football Data Analyst | Transforming data into tactical insights

About Me

Michele Orefice

I am a Football Data Analyst, blending a background in Mathematical Engineering with a specialized Master in Big Data applied to Football from the prestigious Escuela Universitaria Real Madrid Universidad Europea. My mission is to translate complex data into clear, actionable tactical intelligence that empowers coaches, analysts, and decision-makers.

My Master's thesis project, Match Explorer, is an interactive platform I developed from scratch. It transforms raw match event data into advanced visualizations, helping coaches analyze game phases like buildup, offensive and defensive transitions, and set pieces. The goal is to uncover tactical patterns and gain a competitive edge by studying past performances and future opponents.

My expertise covers the entire data lifecycle. I build automated data pipelines using both Python and R (Pandas, rvest, dplyr), ensure data integrity with robust SQL schemas, and transform complex findings into compelling visual stories using a range of tools, from custom Dash/Plotly applications to BI platforms like Tableau/Power BI.

2025

Match Explorer: A Tactical Analysis Platform

Match Explorer Dashboard

As the cornerstone of my Master's thesis at Escuela Universitaria Real Madrid Universidad Europea, I developed Match Explorer, a comprehensive web application built from the ground up with Python, Dash, and Plotly. The project simulates the complete workflow of a professional analyst, tasked with supporting Liverpool FC's coaching staff by transforming raw event data into actionable tactical insights.

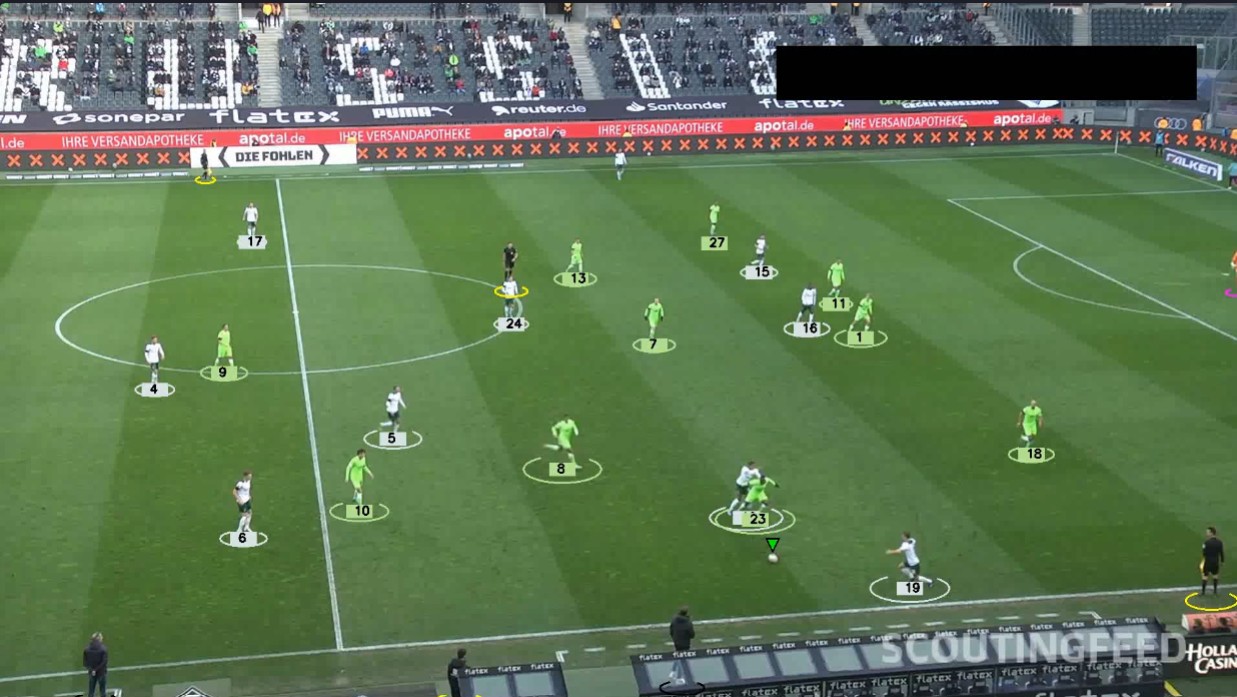
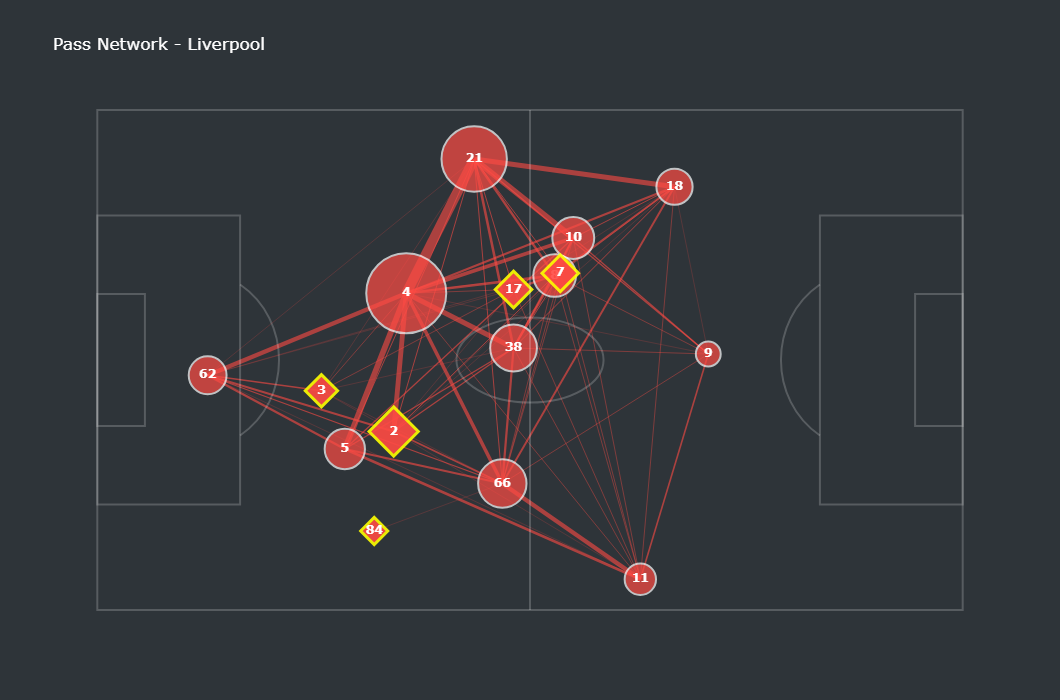
The platform offers a deep dive into game dynamics, allowing for detailed analysis of key tactical phases such as buildup, offensive and defensive transitions, and set pieces. It features interactive visualizations including passing networks, progressive pass maps, player heatmaps, and advanced metrics like PPDA (Passes Per Defensive Action) to evaluate pressing intensity. The ultimate goal is to identify opponents' patterns and validate game plans, as demonstrated in the pre- and post-match analysis conducted for Liverpool's crucial April fixtures.

2024

Player & Ball Tracking with YOLOv8

Computer Vision Player Tracking Output

This project implements a computer vision pipeline to detect and track players, referees, and the ball in match footage. I trained a custom YOLOv8 model on a dataset from Roboflow and used ByteTrack for consistent object tracking. A key feature is the automatic team assignment, which uses a KMeans clustering algorithm to differentiate teams based on jersey colors.

2024

Automated Football Reporting with R

Automated Reporting Pipeline

An end-to-end automated data pipeline built in R that scrapes daily football stats from FBref using rvest, processes the data with dplyr, and generates dynamic HTML reports with rmarkdown. The entire workflow is scheduled for daily execution using taskscheduleR, ensuring insights are always up-to-date.

2024

SQL Database for Injury Management

ERD for the Football Injury Database

This project demonstrates core database engineering skills through a relational database built with SQL. Designed from scratch, it manages football players' injury data, including treatments and specialist involvement. The schema is normalized to ensure data integrity and supports complex queries to analyze injury patterns, treatment efficacy, and specialist workloads.

2023

COVID-19 Insights Dashboard

Tableau Dashboard for COVID-19 Analysis

This project demonstrates an end-to-end data analysis workflow. I processed and queried a large COVID-19 dataset from Our World in Data using SQL to extract key metrics on infection and mortality rates. The findings were then visualized in a public, interactive dashboard built with Tableau to make complex data clear and accessible.

Services

I transform complex football data into actionable insights and smart tools for clubs, agencies and media.

Custom Tactical Dashboards

Interactive platforms like my Match Explorer to analyze buildups, transitions, and set-pieces.

Scouting & Opposition Reports

Data-driven match previews and recaps with clear visuals to support tactical preparation.

Data Pipeline & Automation

From scraping to scheduled reporting: automated workflows that keep your insights fresh.

Skills

Technical Stack

Python
R
SQL
ML
ETL
Git

Data Visualization

Tableau
Power BI
Dashboards
Plotly
Reporting
Computer Vision

Football Analytics

Tactical
Transitions
Set Pieces
Metrics
Storytelling
DB Design

Ready to bring data into your game?

Contact me to discuss how we can collaborate.