
Inter–Napoli ends 3-2, but the scoreline alone risks telling the game in its simplest form: Napoli two goals ahead, Inter increasing the pressure and completing the comeback late on.
The data adds something more interesting.
Napoli do not lose because everything they prepared suddenly stops working. For a significant part of the game they actually manage to do one of the things highlighted in the pre-match: protect the centre and guide Inter’s progression towards the outside.
The problem comes afterwards.
When Napoli win the ball back, too often they cannot turn that regain into a pause, stable possession or an attack capable of forcing Inter to run back towards their own goal.
Inter’s attack ends, but the game does not really change area. A few seconds later, it can start again.
The overall picture helps explain Inter’s territorial weight: 63% possession, 29 shots to 16, 56 touches in the box to 22 and 3.19 xG to 2.24.
That does not mean Napoli are dominated in every phase. Quite the opposite. Between the 50th and 53rd minutes they exploit a window perfectly: Politano makes it 0-1, Højlund adds the second only three minutes later.
The pressing changes the game
Before half-time, the difference between the two teams’ pressure is not yet extreme.
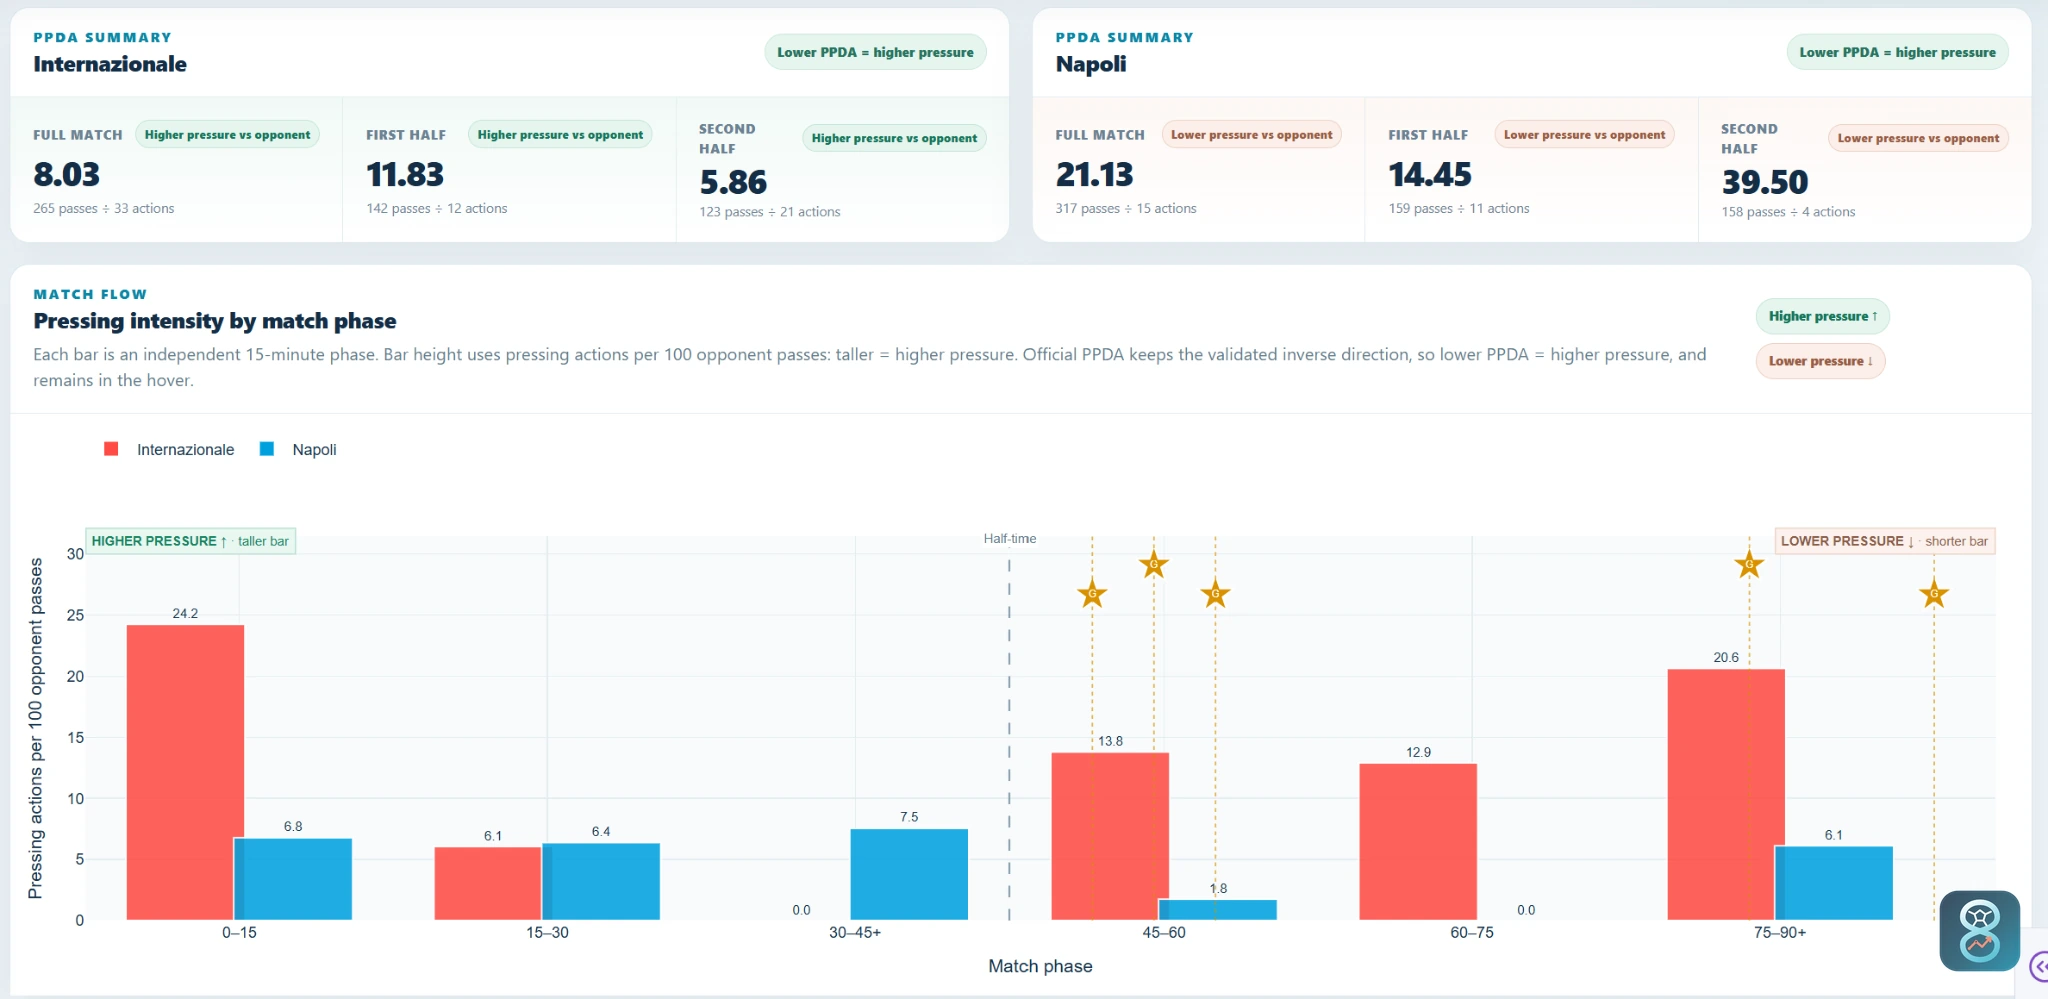
Inter end the first half with a PPDA of 11.83, Napoli with 14.45. Put simply, both teams are still able to disrupt the opponent’s build-up with some continuity.
After the break, the two directions separate.
Inter’s PPDA drops to 5.86: they allow far fewer passes before engaging. Napoli’s rises all the way to 39.50.
Between 45’ and 60’, Inter record 13.8 pressure actions per 100 Napoli passes, compared with only 1.8 for Napoli. Between 60’ and 75’, Inter remain at 12.9, while in the sample Napoli virtually disappear from high pressing.
This is not simply one team attacking more and the other defending more. Gradually, Inter start deciding where the next action will begin.
When Napoli try to play out, the ball returns to the other end too quickly.
Napoli drop deeper. But depth is not the only problem
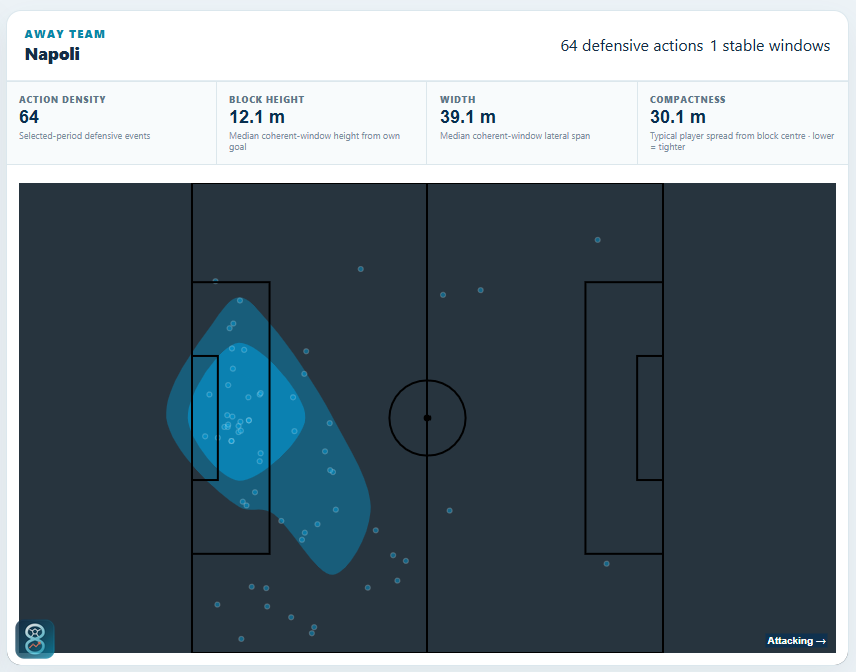
The defensive structure makes visible what the PPDA already suggests.
In one of the most stable phases of the second half, Napoli’s block is measured at around 12 metres from their own goal.
It is not the average position across all 45 minutes; it is a snapshot of a coherent phase of the game. But it captures well the moment when Napoli are pinned back most deeply.
Defending deep is not automatically a mistake. A low block can work if it stays compact and, once the ball is regained, can periodically move back up the pitch.
This is where the game becomes difficult to sustain.
Napoli’s exits are too short. The block has no time to push up and each new turnover quickly brings the team back into the same area.
Inter can therefore accumulate attacks and offensive presence without being repeatedly forced to defend large spaces behind them.
Between the 78th and 79th minutes, with the score still 2-1, the ending also takes on a clearer tactical shape: Inter switch to a 4-4-2 and Napoli to a 5-4-1. Inter add more attacking weight, while Napoli concentrate even more players around their own box. It is not the sole reason for the comeback, but it makes it even harder for Napoli to move up the pitch and relieve the pressure.
Part of the plan actually works
Before the match, one question was very precise: where would Inter enter the final third?
The answer from the pitch is not negative for Napoli.
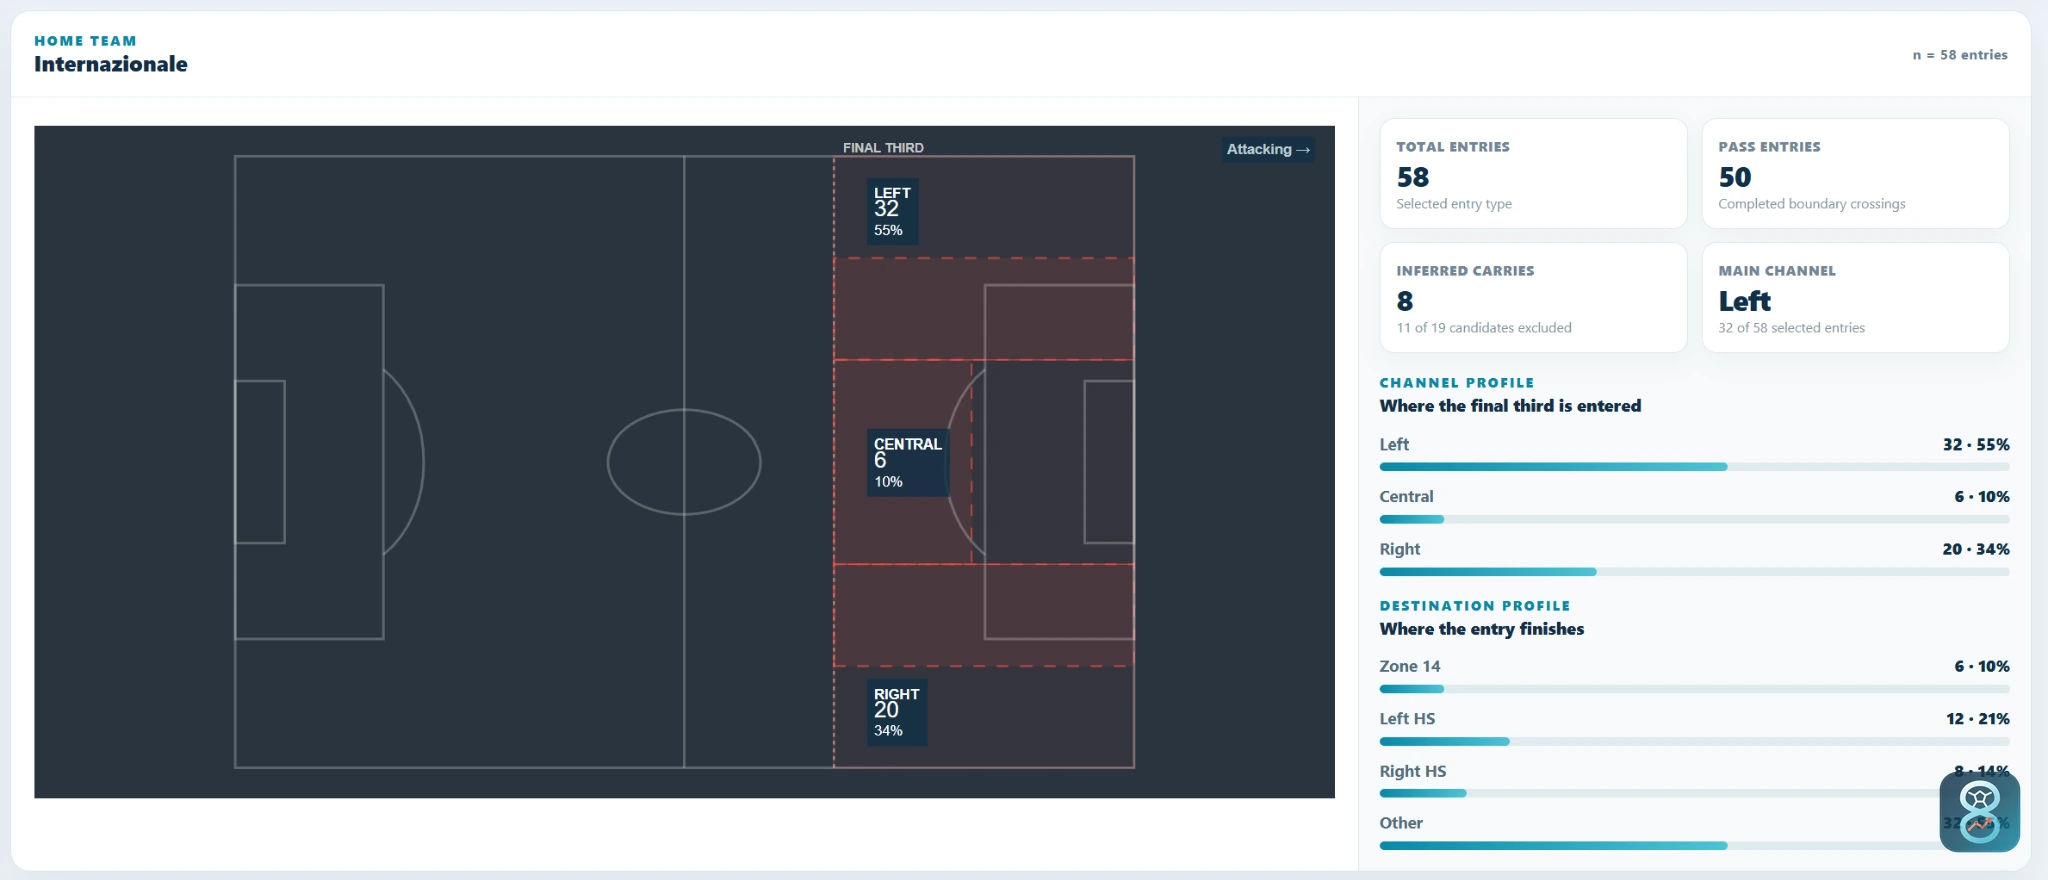
Inter produce 58 final-third entries, but only 6 come through the central corridor: 10%.
The rest are heavily concentrated on the flanks: 32 on the left and 20 on the right.
Napoli therefore do succeed in taking an important part of the pitch away from Inter.
It was also one of the patterns seen in the two derbies won by Allegri’s Milan the previous season: not necessarily stopping every Inter progression, but trying to decide where they are allowed to progress.
For that reason, it would be too simple to say the plan failed. The first step works. What happens afterwards becomes decisive.
This time the crosses are not harmless
It is probably the clearest comparison with the pre-match.
In the derby against Milan used as a reference, Inter had produced 31 crosses. The volume was high, but only 16% allowed the attack to continue and just 6% led to a shot.
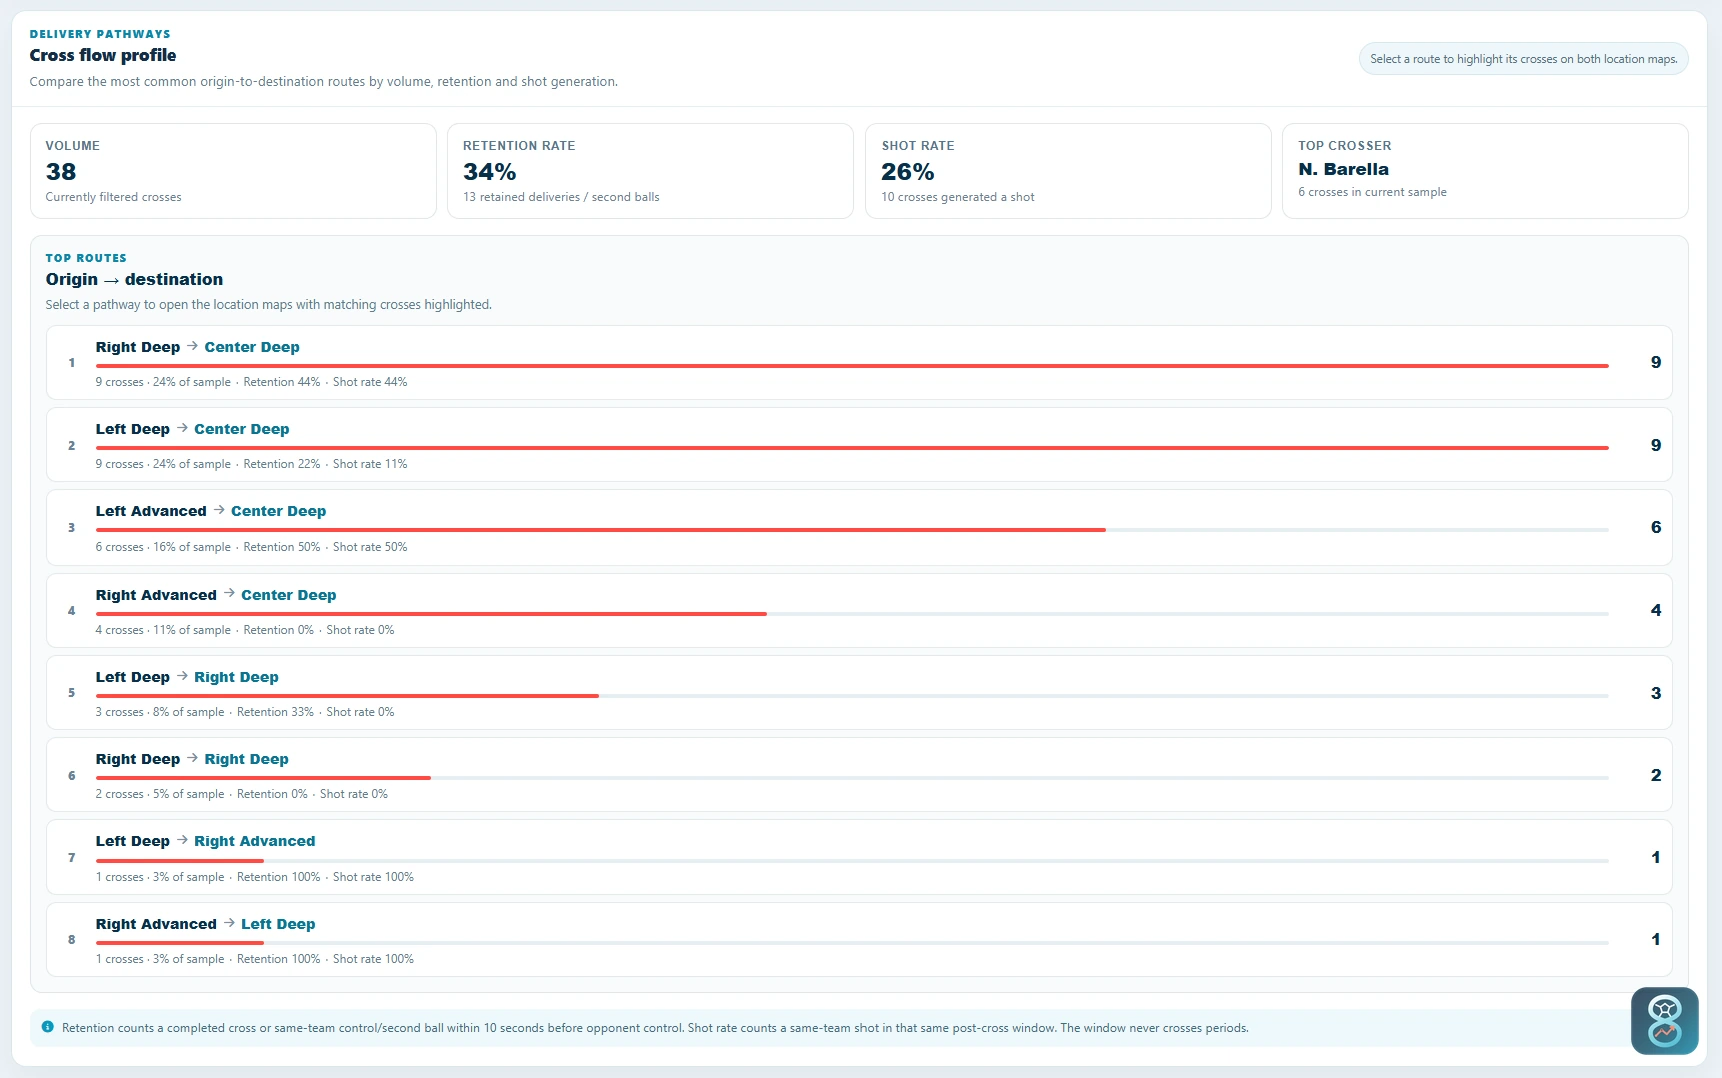
Against Napoli, that rises to 38 crosses. More importantly, what happens afterwards changes.
13 of the 38 crosses allow Inter to keep the ball or continue the attack.
10 of 38 lead to a shot.
This time, wide deliveries create much more football after the cross.
Some routes are particularly effective as well: deeper crosses from the right towards the centre often lead to a shot, as do deliveries prepared from more advanced positions on the left.
And the player who crosses most is not Dimarco, but Barella, with 6 attempts.
That matters because Napoli are not defending one crosser. They are defending a system capable of reaching the same area through different players and different routes.
Napoli close the centre of Inter’s progression. Inter reopen it further forward through crosses, box occupation and second balls.
The problem starts after the regain
This is probably where the most important number of the game appears.
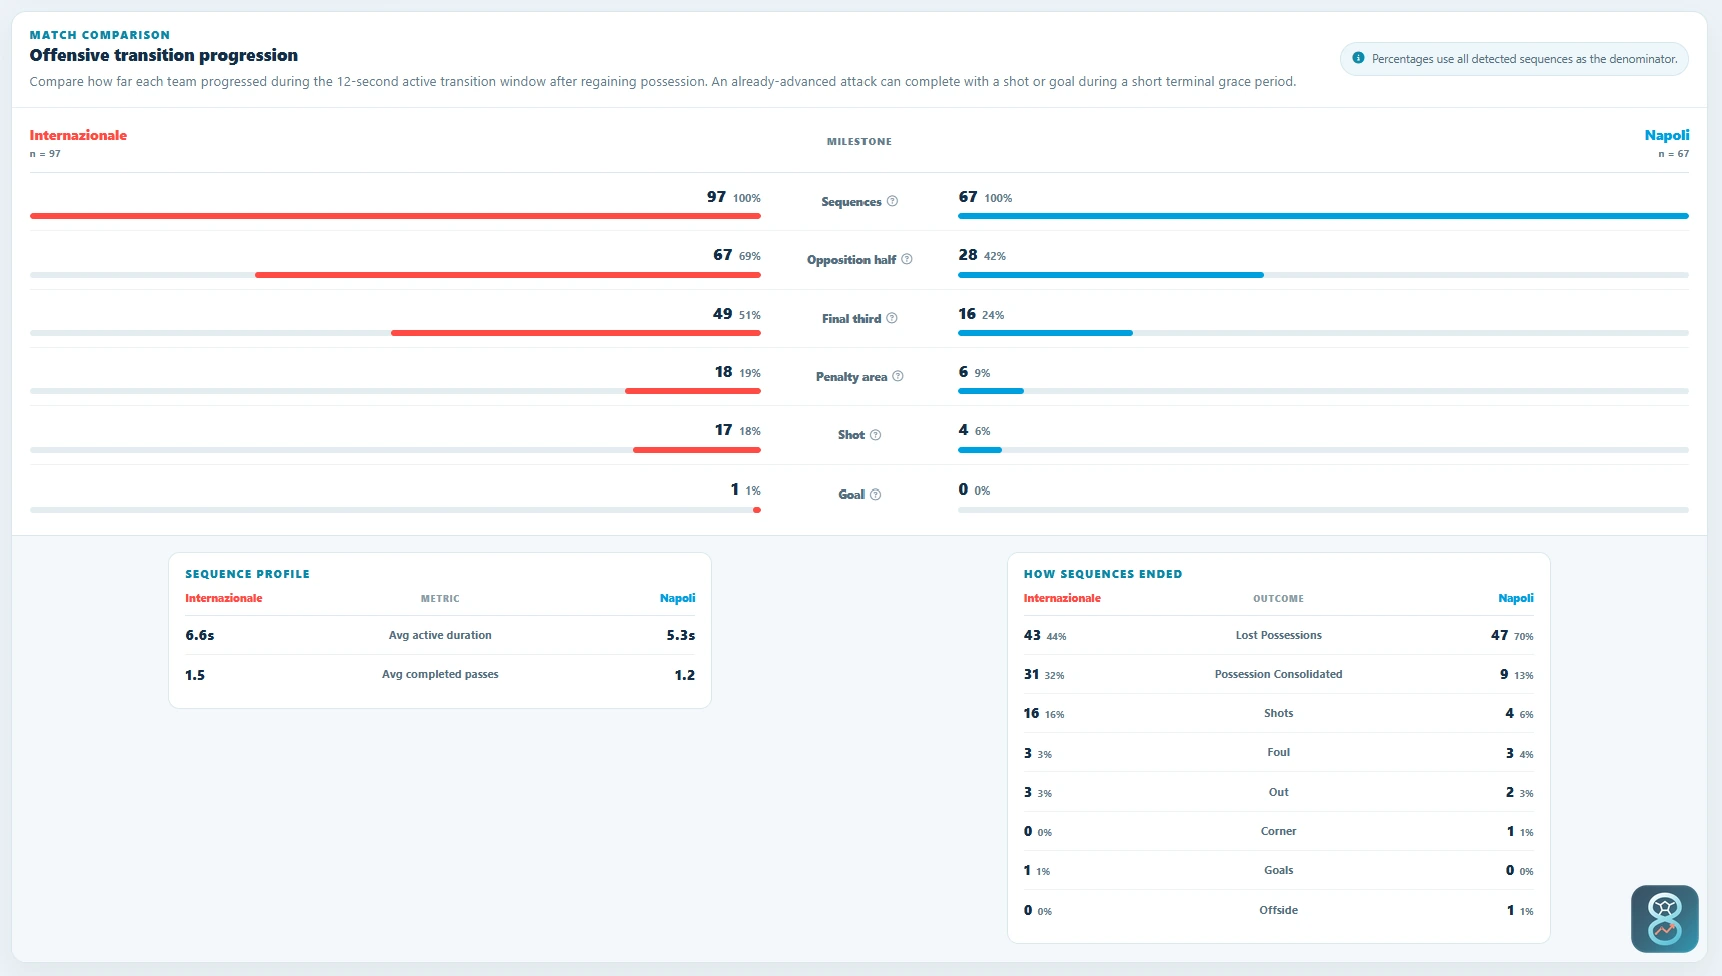
Napoli record 67 attacking transitions.
Only 28, or 42%, reach at least Inter’s half. 16 reach the final third. 6 reach the box. Only 4 produce a shot.
But above all:
47 of 67 transitions, 70%, end with Napoli losing the ball again.
Only 9, or 13%, become stable possession.
Inter show an almost opposite profile. Across 97 transitions they reach the opponent’s half in 69% of cases, the final third in 51%, and manage to stabilise possession in 32% of the sequences.
That difference explains why the pressure can become continuous.
When Napoli regain the ball, too often the sequence ends before it has truly changed the geography of the game. When Inter regain it, they are much more likely to advance or stabilise possession in Napoli’s half.
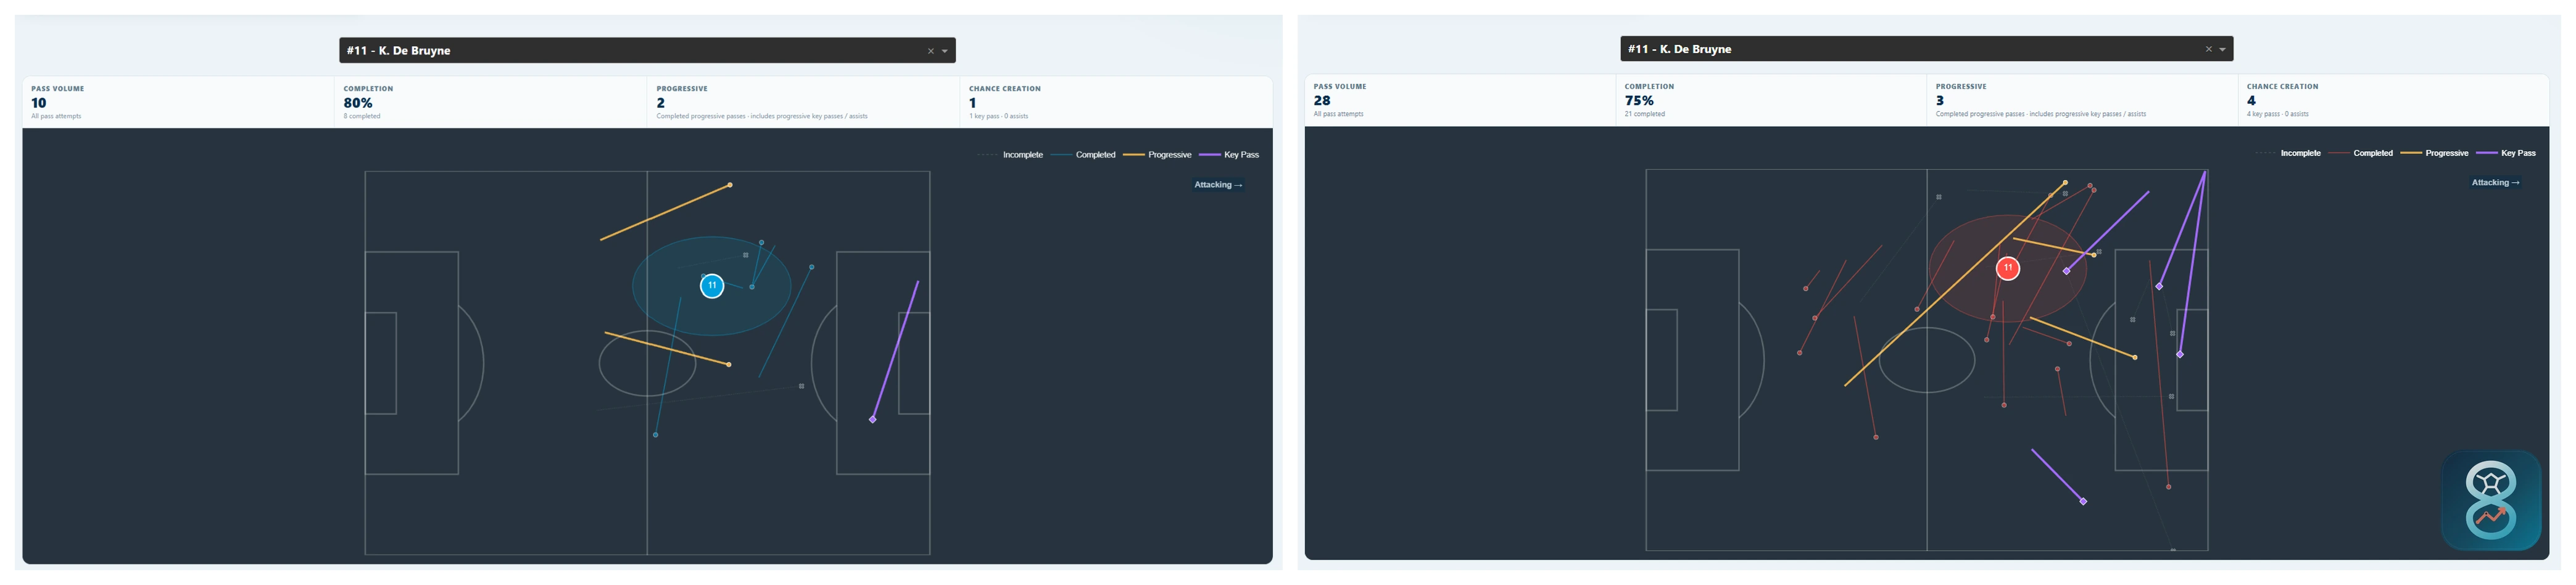
This is where De Bruyne also fits into the story. Against Como, the Belgian changed the tempo because Napoli could get the ball to him with some continuity: in just over half an hour he attempted 28 passes and produced 4 key passes.
At San Siro he comes on in the 62nd minute, but finishes with only 10 attempted passes, 8 completed, 2 progressive passes and one key pass.
The map suggests the problem is not the area he occupies. De Bruyne finds an advanced inside position between the lines, a zone from which he could have accelerated attacks and hurt Inter’s structure with the final pass.
Napoli simply find him too rarely. Their difficulty in stabilising possession after the regain also reduces how often the ball reaches that zone. More than a problem with the final pass, it is a problem with reaching the pass before it.
Andy Diouf, the player the pre-match did not anticipate
A post-match should also show where the game adds something the initial analysis did not anticipate.
One of the main names is Andy Diouf.
He finishes with 54 attempted passes, 47 completed, 4 progressive passes and, above all, 7 key passes.
Even more interesting is where he receives the ball: 47 receptions in total, 25 in the final third and 3 inside the box. More than half therefore come in attacking areas.
It is a detail that makes Napoli’s defensive problem less straightforward.
Inter’s left side accounts for a major share of their progression, but chance creation does not depend on one flank or one player.
Inter stretch the pitch and then find quality from different sources. It is one of the things the game adds to the pre-match reading.
The 2-0 lead was real. But it was not control
There is one retrospective reading worth avoiding.
Napoli were not destined to lose simply because Inter finish with more possession, more shots and more xG. Nor should the 0-2 be erased because the final score becomes 3-2.
Napoli had found a real window in the game and exploited it extremely well.
And even when the game seemed firmly shifted towards Napoli’s box, the result remained completely open.
Late on, Neres gets a shot away in the 88th minute. Roughly a minute later Anguissa creates the even bigger chance: Napoli come extremely close to making it 2-3.
Inter score shortly afterwards instead.
That is exactly what helps separate the result from control.
At 2-0, the priority was to make the possessions following regains last longer. Force Inter to run towards their own goal more often. Move the point from which the next action would begin.
Napoli cannot do it consistently.
The decisive goal comes after a corner, but the reading should remain cautious here too: Inter take 10 corners, and only two produce a shot in the immediate development.
The 3-2 instead comes in a later phase, after the first ball has already been cleared. It is therefore not evidence of systematic dominance from corners.
It is better understood as the final consequence of a game that, by then, has been played too long near Napoli’s box.
The corner is the final trigger. The territory had been built much earlier.
From pre-match to the pitch
Four questions, four answers
The value of the comparison is not in treating the pre-match as a prediction, but in understanding which questions remain useful once the game has been played.
| Before the match | The pitch | Verdict |
|---|---|---|
| Where would Inter enter the final third? | Only 6 central entries out of 58; 52 come from the flanks | Confirmed |
| What kind of crosses would Inter produce? | 38 crosses; 13 continuations and 10 shots generated | Risk confirmed |
| How much space would Çalhanoğlu find in front of the box? | He does not start; Diouf becomes the unexpected creative source with 7 key passes | Scenario changed |
| How would Napoli change without McTominay? | De Bruyne comes on but is reached too rarely; the bigger issue is keeping possession after the regain | Structural problem |
The comeback is built through repetition
Inter–Napoli leaves a lesson that is less simple than the scoreline.
Napoli had correctly identified part of the problem: close the centre, guide Inter outside, avoid easy access inside the block.
That part works.
The game changes when Inter’s wide entries turn into much more productive crosses and, above all, when Napoli stop turning regains into possessions that allow the team to breathe.
From that point, the same sequence starts repeating itself:
That does not mean the result was already written: the late chances for Neres and Anguissa show exactly the opposite.
But it does mean Napoli leave the game for too long in the area where Inter can keep hurting them.
The comeback is built inside that repetition.
Not simply because Napoli defend too close to their own box. But because, for too long, they can no longer move the game away from it.